

Overview
The monthly estimates of hydroelectric power generation by individual plants in Western Canada are developed using an integrated hydrology-hydropower modeling approach (Type 3a, according to the classifications of large-scale hydropower studies36). This integrated approach involves simulating hydrologic processes, including reservoir operations, and subsequently scaling the simulated outputs to estimate hydropower generation. For hydrologic simulations, we extend a modeling approach similar to that presented for the CONUS-wide hydropower estimates22,23 into the watersheds of British Columbia and Alberta in Canada. This extension ensures consistent hydrologic representations of river drainage basins spanning the Western U.S. and Canada, serving as a robust basis for hydropower modeling. As outlined in Fig. 1, a hydrologic model, VIC26,27, is implemented to generate surface and subsurface runoff based on calibrated, grid-based hydrologic parameters. This runoff is subsequently routed overland through streamflow networks and regulated reservoir storages using a river-routing model, mosartwmpy31. To estimate hydroelectric power generations, we apply a streamflow-hydropower scaling approach, which differs from the statistical approach used for the CONUS-wide hydropower estimates22,23 due to the limited availability of utility-level reference generation datasets in Western Canada. Each modeling step is described in detail within the following subsections.
Schematic flow diagram illustrating the processes, models, and inputs to estimate hydropower generation through an integrated hydrology-hydropower modeling approach. Refer to the corresponding subsections for citations.
Hydroelectric power plants
According to the North American Cooperation on Energy Information (NACEI)37, 146 hydropower plants with generation capacities greater than 1 MW are initially identified in British Columbia (123 facilities) and Alberta (23 facilities). Figure 2 illustrates their locations and nameplate capacities, in addition to their associated river drainage basins. Several facilities with nameplate capacities exceeding 1,000 MW are located in the Columbia River Basin in southern British Columbia and the Peace River region in the northern part of the province, which are characterized by extensive reservoir storage with regulation. Other small- to mid-capacity facilities are distributed across the mountain ranges within the Fraser River Basin, the Saskatchewan River Basin, and coastal regions, particularly along the Canadian Cascade and Canadian Rocky Mountains. These facilities predominantly belong to the run-of-river category, where water is diverted from diversion intakes to powerhouses through long penstocks, with little or small storage involved.
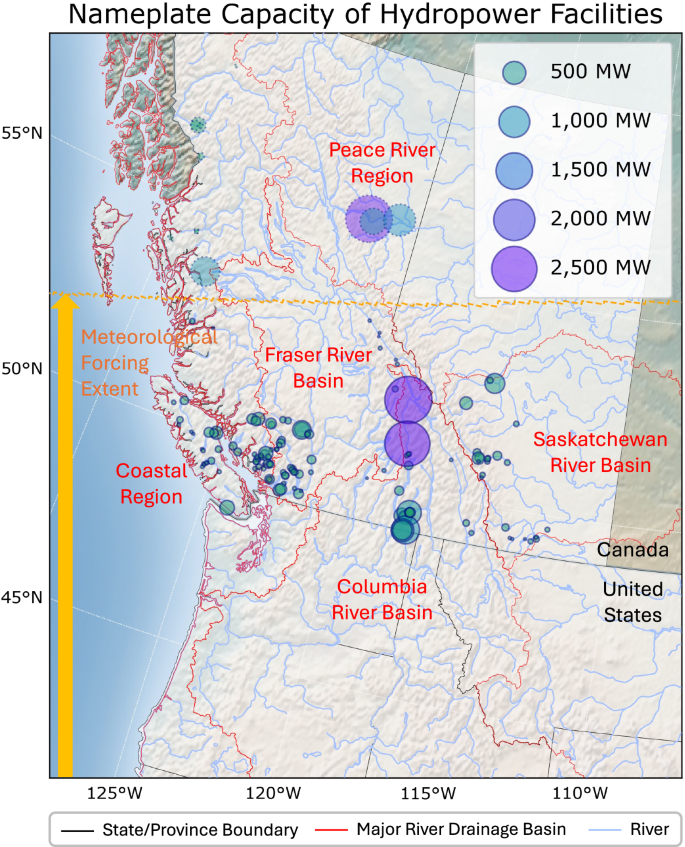
Hydroelectric power plants and associated river drainage basins within the WI region of Canada. The orange arrow shows the spatial coverage of the applied meteorological forcings, with the northern boundary delineated by the dashed orange line. The hydropower facilities outside the forcing extent are shown as light circles with dotted outlines.
Out of the 146 identified hydropower plants, 36 facilities are excluded from the dataset generation process due to the limited spatial coverage of the applied meteorological forcings over northern Canada (15 facilities, indicated as light circles with dotted outlines in Fig. 2) and the lack of corresponding facilities in the reference generation dataset, WECC ADS 203234 (21 facilities). Notably, in northern British Columbia, the facilities located within the Peace River region (Gordon M. Shrum, Peace Canyon, and Site C) and the inter-basin transfer facility (Nechako-Kemano) account for most of the excluded capacities, approximately 5,400 MW. However, the hydropower generation at Nechako-Kemano (896 MW) is mainly consumed by a nearby smelter. In addition, among the 21 facilities (261.4 MW in capacity) which generation is not identified in WECC ADS 2032, there are those primarily built to supply power to local industries (e.g., mine mills at Tennant Lake with 3.1 MW and at Thelwood with 8.2 MW, a pulp mill at Lois Lake with 37 MW, and an LNG export terminal at Squamish Power Project with 1 MW) and those that have halted operations (e.g., Lake Buntzen 2 with 17 MW). Since the generation from these hydropower plants is not primarily used for transmission, their impacts are likely limited for power grid system studies across the WI region. Nevertheless, a few large facilities, such as Forrest Kerr (195 MW), Montrose (73 MW), and those within the Peace River region, need to be further integrated in future studies to make the dataset more comprehensive by leveraging available generation records or by expanding meteorological forcings. In our study, although hydropower plants may have been newly installed, upgraded, or decommissioned between 1981 and 2019, it is assumed that their power generation characteristics have remained constant. Table 2 summarizes the statistics of the hydroelectric power plants that are considered in our dataset.
Meteorological forcing input
The 40-year historical run (1980–2019) of the perturbed thermodynamics simulations24,25 is applied as meteorological forcings in a hydrological model. The climate simulations are based on the dynamical downscaling of the European Centre for Medium-Range Weather Forecasts Version 5 Reanalysis (ERA5)38 using the Weather Research and Forecasting (WRF) model39. The datasets feature a spatial resolution of approximately 12 km over the CONUS, including southern Canada and northern Mexico, and an hourly temporal resolution for surface atmospheric variables. Because of their spatial extent, which covers up to the dashed line in Fig. 2, we exclude the northern portions of Canada, including watersheds with hydropower facilities. Most of the excluded portions belong to separate river drainage basins, such as the Pacific Coast and the Mackenzie River (Peace River). The excluded headwater portions within the Fraser River Basin flow into its mainstem, where no hydropower facilities are installed. While these limitations restrict provincial resource adequacy studies, the presented dataset remains responsive to studies that span multi-provinces and the WI region. Nevertheless, the climate simulations are employed with an emphasis on maintaining consistency with the CONUS-wide hydropower estimates22,23 and potential extensions for future projections based on the perturbed thermodynamics scenarios. Among the numerous atmospheric variables, precipitation, temperature, surface pressure, both long-wave and short-wave fluxes, wind speed, and vapor pressure are extracted with 6-hour intervals and bi-linearly interpolated from about 12 km (1/8th degree) WRF grids into 1/16th degree grids as meteorological forcing inputs for generating runoff in a hydrological model.
Runoff generation
The hydrologic modeling procedure for generating runoff is identical to that presented for the CONUS-wide hydropower estimates22,23. The VIC model26,27 is implemented to generate 6-hourly surface and subsurface runoff through hydrologic processes. It solves water and energy balances at each grid cell to calculate hydrologic states and fluxes on land surfaces. Prior to calibration, the hydrologic parameters of the land-surface domain are initialized using the VICGlobal dataset40,41 that has a resolution of 1/16th degree. The VICGlobal dataset consists of soil parameters derived from the soil texture classifications of the Food and Agriculture Organization Harmonized World Soil Database42 and vegetation parameters derived from Moderate Resolution Imaging Spectroradiometer (MODIS) remote sensing measurements. The detailed methodology for deriving the hydrologic parameters can be found in the data descriptor40.
To calibrate a subset of the hydrologic parameters, the simulation period is divided into two phases: a calibration period from 1981–2000 following a spin-up year of 1980 and a validation period from 2001–2019. As listed in Table 3, the calibration parameters are selected from commonly adjusted VIC parameters found in existing literature32,40,43,44. The Optimization Software Toolkit for Research Involving Computational Heuristics (OSTRICH) model28 is integrated for automatic calibration, where the Dynamically Dimensioned Search (DDS) algorithm45 is applied to the selected calibration parameters for each 1/16th degree grid. The objective function is defined to maximize the modified Kling-Gupta Efficiency (KGE) metric46 for total monthly runoff, in comparison to the Global Reach-level Flood Reanalysis (GRFR) ReachHydro daily runoff dataset32,33, as written in Eq. (1):
$${rm{KGE}}{prime} =1-sqrt{{left(r-1right)}^{2}+{left(beta -1right)}^{2}+{left(gamma -1right)}^{2}}$$
(1)
where r is the correlation coefficient between simulated and observed runoff, β represents the bias ratio of the simulated mean to the observed mean, and γ denotes the variability ratio of the simulated coefficient of variation to the observed coefficient of variation.
Streamflow routing with reservoir operations
The surface and subsurface runoff generated by the calibrated VIC model are aggregated daily to a 1/8th degree resolution with an area-weighted approach and subsequently routed using the mosartwmpy model31, a Python translation of the Model for Scale Adaptive River Transport with Water Management (MOSART-WM)29,30. The MOSART-WM model consists of two primary components: a kinematic-wave flow routing solver and a water management solver. The flow routing solver facilitates the transport of daily runoff through hillslopes, tributaries within each grid, and main channels along connected grids, regulated by reservoir operation rules defined for irrigation, water supply, flood control, and hydropower generation at designated reservoir storage grids. The model hydraulic parameters are obtained from global model applications47,48, while reservoir locations, functions, and characteristics are extracted from the Global Reservoir and Dams (GRanD) v1.3 dataset49.
For reservoir operations, generic operation rules30,50,51 are chosen for their simplicity, given the lack of readily accessible reservoir release and water demand datasets in Western Canada. Within the generic operation rules, the target releases are determined by the primary reservoir functions, such as irrigation and non-irrigation purposes, and the flood control priority. The target releases are subsequently adjusted to account for interannual variability of inflows, seasonal variability in water demand, and monthly release and storage targets to accommodate conflicting objectives like irrigation and hydropower. Minimum environmental flow and storage levels also inform daily release decisions. The rule details are described in the literature30,50,51. The generic operation rules for reservoirs have been effectively implemented to represent water management components, enabling an understanding of water availability and its implications on hydropower generation across the WI14,15,16,18,52,53, CONUS54,55,56, and southern Canada57 regions. Currently, water withdrawal and supply allocation processes are not included in the representation of water management in Western Canada due to the lack of distributed water demand datasets, which should be integrated in future studies for further enhancement. Several Canadian hydropower plants are located within the Columbia River Basin that spans the U.S.-Canada border (see Fig. 2). Consequently, their monthly generation is influenced by hydrologic processes occurring in the U.S. portion of the basin. To utilize the enhanced representation of reservoir operations in the U.S. and maintain watershed consistency across the national boundary, the streamflow outputs for the Columbia River Basin are directly taken from the CONUS-wide modeling results22,23, where more sophisticated, data-driven operation rules58 have been developed using measured reservoir release and water demand datasets. However, the generic operation rules are still applied to other river drainage basins in Western Canada.
The accurate selection of grid locations, which are relevant to hydropower generation, is essential for extracting simulated streamflow outputs for hydroelectric power plants. In Western Canada, however, many run-of-river facilities have diversion intakes installed at a distance from their powerhouses to gain hydraulic heads for generation. In addition, the river networks represented by the 1/8th degree grids may not accurately reflect open channel connections, including confluence or divergence points, around the water sources8. To address these spatial gaps, the representative grid locations of the diversion intakes are determined based on provincial hydropower water license information in British Columbia (Water License Viewer, https://j200.gov.bc.ca/pub/ams/) and Alberta (Authorization Viewer, https://avw.alberta.ca/), and then adjusted to align with the river networks delineated for the mosartwmpy model. The specific links to the water license information for individual hydropower plants are available within Hydropower Facility List described in the Data Records section.
Hydropower annual scaling and monthly allocation
The daily simulated streamflow outputs are aggregated and scaled to estimate monthly hydropower generation, leveraging WECC ADS 203234. The reference generation dataset contains the baseline power grid system conditions for future reliability studies, including generator-level monthly hydropower generation data reported for the year of 2008 in British Columbia and Alberta for Western Canada. Figure 3 shows that the aggregated monthly hydropower generation from WECC ADS 2032 aligns closely with the actual provincial statistics reported by Statistics Canada3. For the 110 hydropower plants listed in Table 2, the dataset provides monthly generation for generators at facilities with large reservoir storages in the Columbia River Basin, namely Mica, Revelstoke, and Arrow Lake, and annual total generation for generators at other facilities. The generator-level generation is aggregated at individual hydropower facilities to obtain the utility-level generation. Since WECC ADS 2032 primarily aims at planning with single-year coverage, it may not be representative of hydropower generation throughout all historical periods. Nonetheless, WECC ADS 2032 is utilized to develop our dataset because it is the only publicly accessible generation records at the generator level for facilities located in Western Canada (see Table 1).
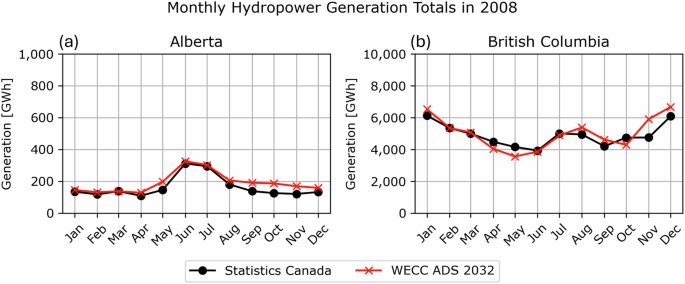
Comparison of WECC ADS 203234 with Statistics Canada3: (a) Alberta and (b) British Columbia. The WECC ADS 2032 plots (red) show the aggregated monthly generation from hydropower facilities listed in Table 2, while the Statistics Canada plots (black) indicate the reported provincial monthly generation statistics.
Annual hydropower generation shows strong correlations with annual streamflow, particularly in the Pacific Northwest region59,60. Based on these correlations, the conversion of streamflow, or even runoff, into generation is often modeled by introducing linear scaling factors21,61, which are subsequently disaggregated using monthly generation patterns14,15,16,17,53. For regulated streamflow outputs, our study applies a similar scaling approach using WECC ADS 2032. Provided with sufficient generation records and corresponding streamflow data, the scaling approach can be refined into a statistical regression approach18,58 based on multi-year conditions that accurately reflect their interannual variabilities. The streamflow-hydropower scaling process involves two main steps: annual total scaling and monthly allocation. First, annual total scaling derives scaling factors for hydropower generation relative to streamflow volumes on an annual basis for individual facilities and applies them to annual streamflow volumes in other years, as written in Eq. (2). Then, monthly allocation disaggregates the annual hydropower generation into monthly intervals based on the monthly distributions of streamflow volumes within each year, as shown in Eq. (3).
$${rm{Annual}},{rm{Total}},{rm{Scaling}}=frac{{rm{Total}},{rm{Hydropower}},{rm{Generation}},{rm{in}},2008}{{rm{Total}},{rm{Streamflow}},{rm{Volume}},{rm{in}},2008}times {rm{Annual}},{rm{Streamflow}},{rm{Volume}}$$
(2)
$$text{Monthly Allocation},=,text{Annual Total Scaling}times frac{text{Monthly Streamflow Volume}}{text{Annual Streamflow Volume},}$$
(3)
Streamflow typically peaks during the summer, due to substantial snowmelt. According to Eq. (3), large streamflow peaks concentrated over specific months can lead to excessive estimates of hydropower generation, compared to the facility’s nameplate capacity. Therefore, monthly estimates are adjusted not to exceed the maximum possible generation based on the nameplate capacity. To account for turbine design capacity and possible water spills, additional capping on daily streamflow can be applied to reflect flow constraints, including those based on flow statistics (e.g., 90th percentile of long-term mean streamflow6 or 4th highest monthly streamflow9,62). In our dataset, diversion intake flow rates, which are collected from hydropower water license information in British Columbia (Water License Viewer, https://j200.gov.bc.ca/pub/ams) and Alberta (Authorization Viewer, https://avw.alberta.ca/), serves as a daily maximum cap when calculating streamflow volumes in Eqs. (2) and (3). The provincial hydropower water license information is available for all 93 hydropower plants in British Columbia and for 10 out of 17 facilities in Alberta. For those facilities in Alberta that lack intake flow rate information (approximately 1.2% of the total nameplate capacity in British Columbia and Alberta), only their nameplate capacities are used to cap the monthly estimates of hydropower generation.
Figure 4 shows a comparison of the monthly capacity factor estimates, integrating an additional cap of intake flow rates on daily streamflow volumes (green line). Compared to those with the monthly capping by the facility’s nameplate capacity (blue line), the additional constraint has little impact on the hydropower generation estimates for facilities with large reservoir storages (Fig. 4a–c; Mica, Revelstoke, and Arrow Lakes), while the aggregated monthly totals for other facilities (Fig. 4d) closely approximate WECC ADS 2032 (red line). As these other facilities include many run-of-river facilities with small storage capacity, their monthly generation peaks during the high flow seasons6, necessitating reasonable streamflow capping to prevent overestimated scaling. On the other hand, facilities with large reservoir storages show little sensitivity (no difference between blue and green lines) to the additional constraint because their intake capacities are accordingly large. The WECC ADS 2032 capacity factors for the three hydropower plants indicate seasonal patterns that lag by a few months from the high flow seasons, with relatively low generation during spring to summer and winter-peaking in fall to winter. These noticeable lags in generation are not adequately reproduced by the hydropower scaling based on the streamflow simulations using the generic reservoir operation rules, likely due to the limited representation of water management practices for reservoir regulation. Large hydropower facilities can significantly alter streamflow seasonality through water retention, regulation, and diversion13, requiring more data on reservoir operations to develop sophisticated model rules. With the lack of such details, the annual generation totals for the Mica, Revelstoke, and Arrow Lakes facilities are updated for each year, but their monthly allocations are directly extracted from the WECC ADS 2032 generation for 2008 and applied identically to other years. In future studies, the presented dataset could be further improved by integrating accurate water management practices and hydropower generation datasets into refined reservoir operation simulations and subsequent hydropower estimations, respectively. For instance, data mining techniques5 can be implemented to systematically collect near real-time operational observation or forecast data (typically available for the most recent few days) and planning documents. Based on the collected data, more advanced approaches, such as data-driven methods58,63, can be applied to derive water management practices and inform reservoir operation simulations.
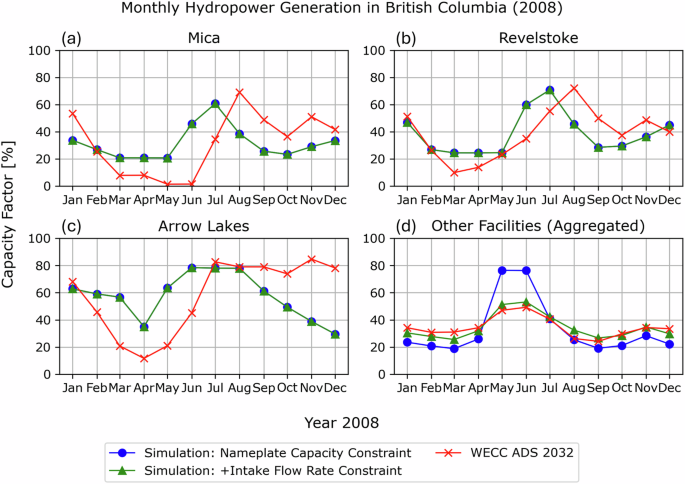
Comparisons of monthly capacity factor estimates with WECC ADS 203234 for (a) Mica, (b) Revelstoke, (c) Arrow Lakes, and (d) aggregated other facilities. The capacity factors are calculated using the nameplate capacities of the facilities. The blue and green lines represent the simulated estimates constrained by nameplate capacities and by additional intake flow rates, respectively. Both lines overlap for the (a) Mica, (b) Revelstoke, and (c) Arrow Lakes facilities, which are associated with large reservoir storages. The red lines indicate WECC ADS 2032, which annual totals serve as a basis for hydropower scaling.
For WI-wide power system studies, the inputs for Production Cost Models (PCMs) and Capacity Expansion Models (CEMs) are additionally produced for 110 hydropower plants based on the monthly generation estimates for 1981–2019. The input variables include monthly generation constraints of maximum, minimum, and daily operation range. Given the lack of observed generation datasets at finer time scales to define these variables for individual facilities in Western Canada, we leverage empirical parameters relative to monthly mean generation by facility type (either reservoir storage or run-of-river)35. The empirical parameters are derived from the EIA hydropower generation records (https://www.eia.gov/electricity/data/eia923/) and their imputations6 for 2001 to 2022 in the U.S. Pacific Northwest within the WI region.
The estimated power system model-ready hydropower dataset from 1981 to 2019 includes monthly potential hydropower generation and associated flexibility metrics (minimum and maximum hourly generation and daily fluctuations). Our dataset covers the WI region in Western Canada and supports power system studies over the entire WI, enabling spatial and temporal coincidence in hydropower representation along with the CONUS-wide hydropower estimates22,23. While this dataset cannot be used to design water-energy operations under extreme events or support contingency analyses, it can be used for informing large-scale long-term electricity planning. Specifically, the presented dataset focuses on the importance of coincidence and inter-annual variability, which are key to inform regional dependencies and price signals. This dataset can also be utilized for evaluating future infrastructure needs, such as long-term energy storage and transmission across regions15, hence assessing proposed investment policies. However, the dataset is not intended to inform cross-border cooperation, which would require higher fidelity models; it can help motivate the need to evaluate specific events to be simulated with higher fidelity models. Furthermore, the data availability of multiple water year conditions will support the update and enhancement of previous studies that were focused solely on the U.S.8,18,21,56,61,64,65.