

Legacy downscaling method
Our methodology for downscaling yearly hydropower generation data to monthly intervals builds upon the downscaling technique established for RectifHyd6. This traditional method can be outlined as follows. For every facility and year, we possess an annual cumulative net generation (MWh) that needs to be assigned among calendar months in a manner that adheres to the primary factor influencing monthly hydropower—specifically, water availability. To achieve this, RectifHyd utilizes two distinct water-related indicators of hydropower generation: daily reservoir outflow (when accessible) and daily streamflow at the outfall of the HUC4 basin where the facility is situated (if reservoir outflow time series are not available). In each year, the documented annual net hydropower generation is distributed among the months based on how the water indicator is divided across those months. To illustrate, if 15% of total water released from a specific dam in year Y occurs in January of year Y, then 15% of the annual hydropower for year Y will be assigned to January. One significant detail is that prior to constructing monthly total water volumes from daily flow data for downscaling, a limit is applied to the daily time series to account for spills. This limit is established at the 90th percentile of the daily flow record. The new RectifHydPlus dataset enhances this traditional method by employing superior proxy data and introducing a more locally pertinent spill adjustment process for each dam (Table 1).
Summary of new downscaling method
In preparing RectifHydPlus, we begin by identifying target facilities (i.e., CONUS facilities with nameplate >10 MW) and then compile reported annual net generation totals from numerous EIA files (see Plant selection and annual data preparation). We assign unique plant identifiers (RectifHydPlus ID, or “RHPID”) and associate each plant identifier with other identifiers for the dam, reservoir, river segment, and watershed (see Mapping hydropower plants to dams, reservoirs, and rivers). This association enables us to connect plants to the site characteristics and hydrological time series data necessary for generating new proxy information for downscaling annual generation to monthly figures. For each dam, we endeavor to create a daily water release time series from five different proxies: observed reservoir release (optimal proxy), river discharge immediately downstream of the dam (strong proxy, but potentially affected by overlapping inflows between the dam and gauge), simulated flow at the dam site applicable to run-of-river facilities only (good/moderate proxy), simulated reservoir release (good/moderate proxy), and observed river discharge at the HUC4 outlet (weakest proxy, contributing 22% of downscaling in RectifHydPlus—down from 88% in RectifHyd Version 1)—see Development of daily water release. We choose the best proxy available for each dam and then modify the daily time series to consider spill (i.e., water releases that skip the turbines) before aggregating to a monthly scale for downscaling use. This technique resembles the RectifHyd approach, with the primary distinction being that here, we adjust the spill percentile individually for each dam (Spill adjustment and aggregation to monthly powered release totals). Once the spill-adjusted monthly proxy data is prepared, downscaling is carried out on both the observed annual generation totals and a synthesized set of annual generation totals for the hydrological control scenario (see Hydrological control scenario), leading to two distinct datasets of monthly generation: RectifHydPlus_HIST (historical) and RectifHydPlus_CTRL (hydrological control) (Fig. 2). The code necessary to replicate RectifHydPlus is organized in a formal data pipeline and shared in an open repository (see Code Availability).
Process flow diagram illustrating essential inputs, decisions, and processes in the creation of RectifHydPlus. Key input data include Hydropower Infrastructure – Lakes, Reservoirs, and Rivers (HILARRI) Version 319; ResOpsUS17; Dayflow Version 223; Existing Hydropower Assets (EHA) Plant Database22; Inferred Storage Targets and Release Functions (ISTARF) for CONUS reservoirs24; RectifHyd Version 16; EIA surveys 906/920/9235; EIA survey 86018; Hydropower Energy Storage Capacity Dataset, Version 221.
Plant identification and annual data preparation
The hydrologic data utilized to formulate proxies of generation in RectifHydPlus are presently unavailable for Alaska and Hawaii. We, therefore, select RectifHydPlus plants by initially filtering all plants in the most recent EIA-923 dataset5 for conventional hydropower facilities located in the contiguous United States. We subsequently eliminate plants with nameplate capacities less than 10 MW—resulting in 607 distinct EIA identifiers. Removing smaller plants (<10 MW) enhances the accuracy confidence of the downscaled monthly data. This is due to the proxy data necessary for downscaling annual generation to monthly often being unavailable or excessively unreliable for smaller streams. The new proxies introduced in RectifHydPlus require precise connection of the plant to the river segment—an increasingly difficult task with smaller plants, which are frequently located on channels or canals rather than the natural river system. Almost no small plants (<10 MW) in the legacy RectifHyd dataset benefit from robust data proxies (i.e., reservoir release from ResOpsUS17), and the alternate proxy (observed river discharge at the HUC4 outlet) often misrepresents the hydrologic conditions of small tributaries where smaller plants are commonly sited. This 10 MW capacity threshold indicates RectifHydPlus encompasses considerably fewer plants than the legacy dataset (RectifHyd Version 1 includes 1,492 plants). Nevertheless, RectifHydPlus accounts for 96% of US installed hydropower capacity; exclusion of small plants <10 MW should therefore not diminish the utility of RectifHydPlus for most practical settings. Applications involving regional analysis of hydropower variability, or the development of input data for power system models, are better supported by enhanced accuracy at the larger facilities rather than inclusion of all potential plants.
Next, the 607 EIA identifiers are employed to extract historical plant capacities from EIA-860 (all years 1980 through 2022)18 and annual net generation totals from forms EIA-759 (covering years 1980–2000), EIA-906 (1989–2000 nonutility), EIA-920 (2001–2007), and EIA-923 (2008–2022)5. Some plants in the EIA datasets are divided across two or more EIA identifiers. For example, Hoover Dam has separate EIA identifiers for the Arizona (EIA ID 154) and Nevada (EIA ID 8902) powerhouses located on either side of the Colorado River. While state-level reporting requirements and political reasons may motivate the splitting of plant data in this manner, the appropriate representation of a plant for the purposes of RectifHydPlus is one identifier per dam/reservoir. We therefore merge Hoover Dam (and similar cases) into a single plant, creating a new identifier (the RectifHydPlus identifier, or “RHPID”) that combines the plant’s EIA IDs and plant names (inherited)
from HILARRI Version 3) to a consolidated string (e.g., Hoover Dam transforms into “154/8902_HOOVER DAM (NV & AZ)”). This results in 590 distinct RHPIDs to be associated with hydrologic data and site attributes.
Linking hydropower facilities to dams, reservoirs, and rivers
We associate each RHPID with its corresponding dam, reservoir, and river reach utilizing HILARRI version 319. HILARRI connects US power facilities to identifiers in various supporting datasets—namely the Global Reservoir and Dams (GRaND) ID (which provides a connection to reservoir data and specifications for 328 dams20), National Inventory of Dams (NID) ID (linking to dam specifications at 526 dams), Hydropower Energy Storage Capacity (HESC) dataset (providing estimates of hydraulic head at select dams21), and the Existing Hydropower Assets (EHA) database22 (linking to facility locations and operational modes, including the identification of run-of-river systems). HILARRI additionally supplies the USGS station ID for flow gauges immediately downstream of the dams, offering a crucial indicator of reservoir discharge that acts as a proxy for generation. This linking effort culminates in a plant to water data association table (one row per 590 RHPIDs) including the following columns: RHPID, GRaND_ID, NIDID, COMID, HUC12, HYD_HEAD_m, OPERATING_MODE, LON, LAT, USGS_GAUGE. The plant to water data association table is included in the RectifHydPlus data release.
Creation of daily water release data
Downscaling annual hydropower to a monthly resolution in RectifHydPlus presumes that the distribution of monthly energy generation totals throughout the year can accurately reflect the distribution of monthly powered water release volumes at the dam (i.e., total release minus spill). A potential drawback of this method is that powered water releases ignore possible fluctuations in the rate of flow conversion to power. Such fluctuations occur due to varying unit efficiencies or changes in hydraulic head driven by alterations in headwater and tailwater elevations at the dam. In the absence of turbine efficiency curves and pool elevation time series for headwater and tailwater, such specifics cannot be easily integrated into RectifHydPlus. Findings from RectifHyd Version 1 show that monthly powered release volumes (where accessible) serve as an excellent proxy for monthly generation. A primary objective of RectifHydPlus is therefore to enhance the number of plants that accurately represent this variable.
In RectifHydPlus, we utilize the closest available representation of water release for each plant and operational year. This implies some plants may be linked with multiple sources of water release data over the 40-year span. There is no necessity for a uniform data source for a specific plant, as each year of operation is downscaled independently. Similar to the legacy version of RectifHyd, direct observations of reservoir release are the most preferred data. We incorporate daily reservoir water records from ResOpsUS17, which amalgamates US reservoir operation records obtained through web scraping from various agency data portals (CDEC, USACE, USBR, TWDB) along with data gathered from a national-scale survey of dam operators. If, for any given operational year at a plant, the observed reservoir release data is not available, RectifHydPlus takes the next best available estimate of reservoir release: river discharge recorded immediately downstream of the dam. If these are also unavailable, the next closest representation of water release is selected, and so forth. The priority order for water release data is: (1) direct observation of release from ResOpsUS, as outlined above; (2) river discharge at a USGS gauge within 10 km downstream of the dam (expected to closely match a direct release observation unless the discharge is interrupted between the dam and gauge, such as by tributary inflow or notable discharge or withdrawal); (3) simulated river discharge at the dam site, sourced from Dayflow Version 223, and used solely if the plant is of the run-of-river type; (4) simulated reservoir release from the dam, based on water release protocols defined in the Inferred Storage Targets and Release Inference Functions (ISTARF)24; and (5) discharge from the USGS gauge at the HUC4 outlet, as adopted in RectifHyd Version 1.
Spill adjustment and aggregation to monthly powered release totals
Prior to being utilized for downscaling annual generation, the daily release time series must be modified to account for the portion of water that bypasses the turbine, known as spill. A common technique for spill estimation in a large-scale study is to cap the daily flow at an arbitrary percentile intended to represent turbine flow capacity. This method is applied in the RectifHyd legacy dataset, which assumes a cut-off at the 90th percentile—implying flow is constrained by a maximum value of the 90th percentile of daily flow. In RectifHydPlus, we enhance this adjustment by calibrating the percentile at which total release is capped to account for spill. Our calibration process is as follows. For a selected percentile, one can compute daily powered release volumes (i.e., release with spill removed), aggregate these to yield monthly powered release volumes, assign a fraction to each month based on how much each month’s volume contributes to the total annual powered release volume, then apply those same fractions to the annual generation to obtain monthly generation. Since monthly generation observations are broadly available in EIA survey data prior to 2003, one can optimize the spill percentile value to provide the best representation of monthly generation during those years. The optimal spill fraction can then be applied across all years at the dam. In RectifHydPlus, this spill quantile is determined using Brent’s method25, minimizing the root mean squared error between observed and modeled monthly generation. Once the spill quantile is calibrated for a plant, the final daily powered release time series is established and then aggregated to monthly water volumes to be directly used in downscaling annual generation to monthly across all years.
The above procedure reveals a median spill percentile of 0.85 (85th percentile) across all plants (Fig. 3). Approximately 37% of plants are characterized by a spill quantile larger than 0.9 (indicating spill occurs on fewer than 10% of days). Reservoirs with large storage capacities tend to be associated with infrequent spilling (i.e., higher spill percentile). Smaller reservoirs often lack sufficient capacity to capture substantial inflow events, while small plants (by nameplate) have limited ability to convey high flows through turbines. High rates of spill frequency are therefore more prevalent in small storage dams with low plant nameplate. Examination of monthly generation estimates obtained using the newly calibrated spill values indicates the merit of this approach, exhibiting significant improvements in generation accuracy compared to the 90th percentile assumption of the legacy dataset (see Technical Validation).
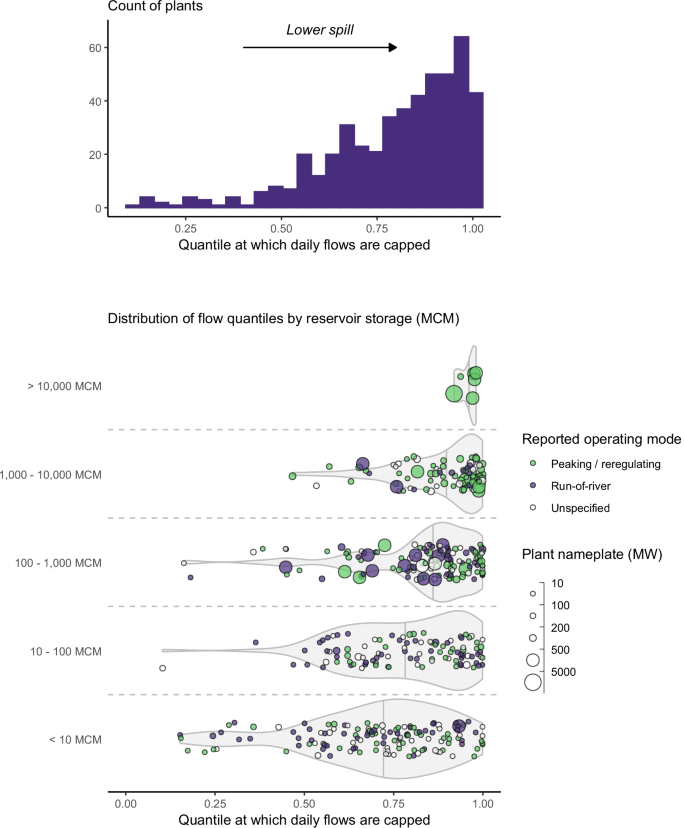
Calibrated spill quantiles for each plant represented in RectifHydPlus. Upper panel shows the overall distribution. Lower panel presents the same data, categorized by reservoir storage type (larger storage is associated
with reduced spillage).
Hydrological governance scenario
RectifHydPlus incorporates a fresh hydrological governance scenario (“RectifHydPlus_CTRL”) that serves to supplement the historical generation projections (“RectifHydPlus_HIST”). This new dataset is created by parameterizing an annual flow to capacity factor model for each facility, which is subsequently utilized to simulate the annual capacity factor as a function of hydrological circumstances from 1980 to the present. Modeled annual capacity factors are transformed into generation figures based on current nameplate capacity and are then adjusted to monthly generation using the monthly proportions derived from historical generation scaling discussed previously. The annual capacity factor model is the Energy Limited Capacity Factor Curve (ELCFC) introduced in16:
$${{CF}}_{{yr}}=frac{{E}_{{yr}}}{widetilde{E}}=1+,{varphi }_{{yr}}-{(gamma +{{varphi }_{{yr}}}^{tau })}^{1/tau }$$
$$varphi =frac{{hat{E}}_{{yr}}}{widetilde{E}}=frac{rho times gtimes htimes {Q}_{{yr}}times (2.78times {10}^{-10})}{widetilde{E}}$$
The model connects a plant’s capacity factor (annual energy ({E}_{{yr}}) divided by annual maximum energy (widetilde{E})—both expressed in MWh) to its full capacity potential (annual potential maximum energy ({hat{E}}_{{yr}}) determined by available water, divided by annual maximum energy (widetilde{E})) employing two calibrated parameters, (gamma ) and (tau ), where (rho ) represents the water density (1000 kg/m3), (g) signifies gravitational acceleration (9.81 m/s2), (h) indicates the hydraulic head of the plant (m), and ({Q}_{{yr}}) is the yearly total inflow volume (m3). The constant (2.78times {10}^{-10}) converts annual potential maximum energy from Joules to MWh. The rationale, visualization, and validation of the model are elaborated in16. Here, we acknowledge that this model has shown to be more effective than linear models of annual hydropower, adhering to critical physical restrictions related to the capacity limit of the plant (the model will never yield CF > 1) and the energy potential in flow (the model cannot generate energy surpassing the energy potential given annual flow).
Data are organized for model calibration as follows. For each RHPID, historical plant capacities (MW) are transformed into maximum annual generation (widetilde{E}) (MWh) by multiplying by the number of hours in each year (considering leap year variations). Actual annual generation divided by maximum annual generation subsequently produces the time series of annual capacity factors. Annual water availability (({Q}_{{yr}})) is then ascertained using summed daily flow volumes from either ResOpsUS17—if available for the entire duration of 1980–2019—or Dayflow Version 223. The hydraulic head, (h), is sourced from the Hydropower Energy Storage Capacity (HESC Version 2) dataset21. Model calibration occurs for the timeframe from 2005 to 2019 (i.e., the latter 15 years of the 40-year series), capturing capacity factors pertinent to current operations. Parameters are fitted using the Limited-memory Broyden-Fletcher-Goldfarb-Shanno algorithm, referred to as “L-BFGS”26. The resulting model is then used to simulate annual capacity factor for the comprehensive period of 1980 to 2019. Lastly, we multiply the simulated capacity factors by current (year 2022) plant nameplate to yield the annualized hydrological control hydropower generation time series.
To transform to monthly generation, the hydrological control data are linked with the same downscaling factors established for the historical data in RectifHydPlus, resulting in a complete set of monthly generation totals for all 590 facilities. For illustrative purposes, a comparison of RectifHydPlus historical generation (RectifHydPlus_HIST) versus RectifHydPlus hydrological control generation (RectifHydPlus_CTRL) is provided in Fig. 4, highlighting results for the Vernon hydropower facility on the Connecticut River (EIA identifier 2352). This facility underwent a major capacity enhancement in 2007/2008, with nameplate increasing by 71% from 20.4 MW to 34.9 MW. Consequently, we observe considerably elevated generation in RectifHydPlus post-2009, which is mirrored in the hydrological control case extending back through the earlier years of record. This instance also illustrates how the hydrological control case excludes historical periods of outage, like in 2007 when output was reduced during the upgrade operations.
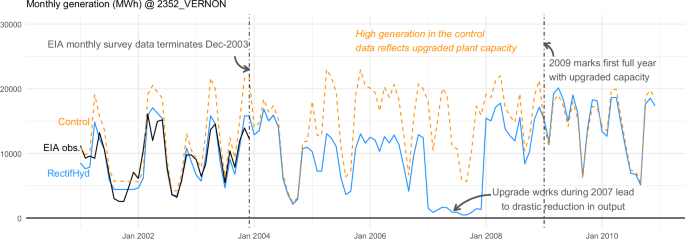
RectifHydPlus provides historical and hydrological control scenario monthly generation time series. This example exhibits a portion of the data for Vernon hydropower plant (EIA 2352). The data demonstrate RectifHydPlus model performance (during pre-2004 period for which actual monthly observations are accessible) and reveal notable differences between historical estimates and hydrological control scenario, with the former reflecting diminished capacity as well as a major outage in 2007.
The RectifHydPlus_CTRL generation projections may also be lower than RectifHydPlus_HIST. If a facility has encountered a capacity reduction (e.g., a unit decommissioning) or if its efficiency has noticeably declined, the hydrological control case will yield lower generation compared to historical in the earlier sections of the record. At the aggregated level of power balancing authorities, the data indicate a general trend for the annual hydrological control generation to be slightly less than the annual historical generation (Fig. 5). This predominantly reflects the overall diminished power generation capabilities of plants notwithstanding capacity enhancements, attributed in16 to plant wear and tear along with changing operational policies in favor of non-power objectives. Exceptions exist in the NWPP, PJM, and NEISO regions, where the hydrological control case results in marginally increased annual generation compared to historical.
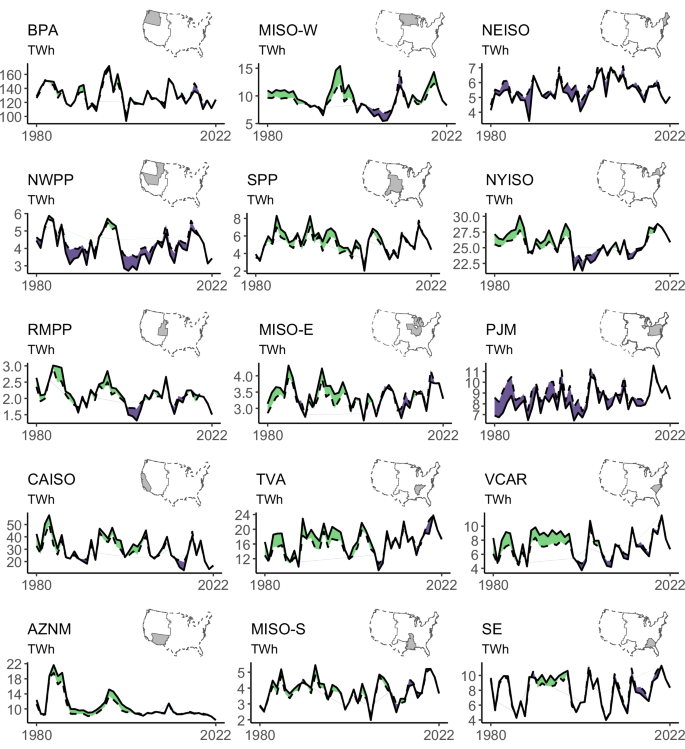
Annualized hydropower totals for fifteen balancing authority regions (based on the Regional Energy Deployment System, ReEDS, model regions). The solid line indicates actual historical annual generation while the dashed line represents the hydrological control. Light green signifies that the hydrological control scenario generation is lower than actual historical, while dark blue indicates that hydrological control scenario generation surpasses actual historical generation.